Tool
Server Monitor
A lightweight server monitoring tool for visualizing CPU, RAM, and disk usage including historical trends as well as blocked SSH attacks through fail2ban.
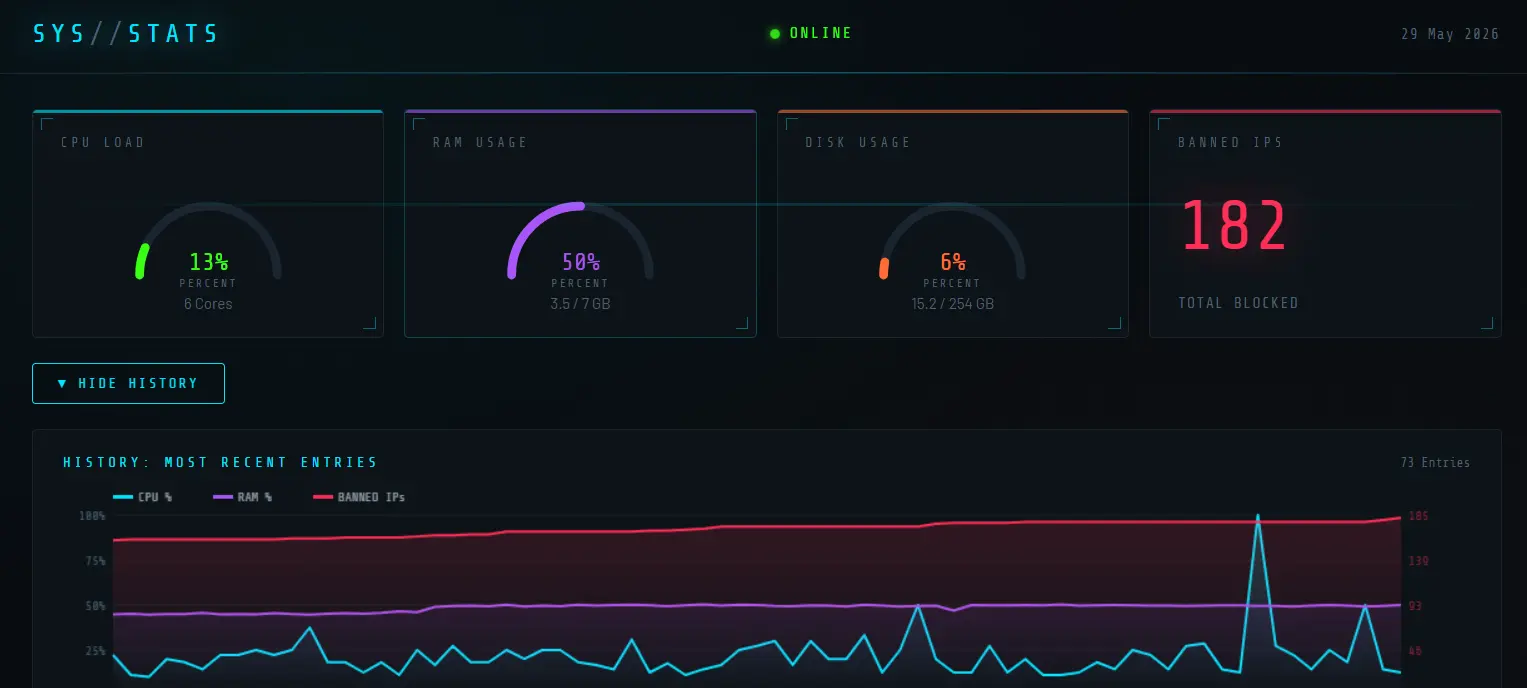
This tool provides a quick and clear overview of the status of my server without burdening the system resources with heavy monitoring agents. It visualizes the utilization of CPU, RAM, and disk space, including a historical progression.
Additionally, it integrates a security component that shows how many automated, malicious SSH login attempts were successfully blocked by fail2ban.
The project strictly separates data collection and display from each other to ensure maximum performance and data security during deployment:
-
Data collection: A cron job on the server collects the current system and fail2ban metrics every hour and stores them in a central sys_stats.json.
-
Data backup: The JSON file is automatically copied into the public folder of the website. This ensures that the historical data is permanently preserved even after new code deployments or updates of the web app.
-
Visualization: The frontend (this project) reads the generated JSON file and processes the data into clean, interactive graphs for the user.
A practical tool for personal use that takes the manual checking of logs off my hands in everyday life and makes server monitoring noticeably more efficient and stress-free.